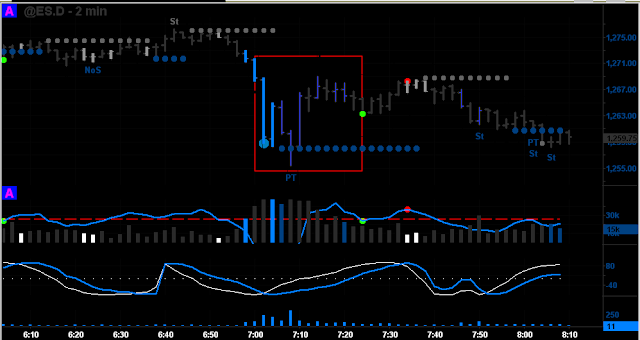
The ES was hammered today on news that Japan's Nuclear crisis has worsened.
After a Gap down and rather calm morning the ES seemed to be headed north for the day as a tight trend progressed to mid morning. @ approximately 8:00 News broke that Japans Nuclear issues had worsened, this compounded with rising food cost and crude and lower housing starts was enough for the ES to drop 30 points in a matter of minutes. Fortunately i was on the sidelines waiting for opportunities after a rewarding morning of trades.
The main feature of the day was the amount of BLOCK trades that took place at this time and continued throughout the day, they appeared in areas that Pro/Am and Better Volume neglected (which is the point after all) in key reversal points and breaks. To note the difference between BLOCK trade size and Volume. Block trades are private institutions (Dark Pools) that negotiate huge lots at a single price or multiple prices and are not registered as standard auction volume so they don't show up as volume and the public never sees the transaction nor its history (BLOCK trades have NO available historical data, after your station is closed or refreshed you LOOSE block information for that day) it is Current Real time data only. Hmm!! wonder why.
This is very important as Dark pools activity remain virtually anonymous to the trading public, one must know that these pools are huge manipulators especially in after market trading, so if we can piggy back on there reactions to S/R we can get further insight and direction. But today they showed up in droves during peak NYSE trading hours.
2 minute chart shows massive sell off and Blocks Stepping in at Wholesale and Dumping at retail.
**Blocks above 200 show up in Purple Bars, pro/am caught some as well**
Blocks showing up on 4500 tick at key reversal points. ** Notice the HUGE block bar appearing where Pro/Am shows No Supply and Rambos 10:08 area!!! Hidden Volume indeed!!**
This is the same 4500 tick with Pro/Am indicator removed ** Huge block bar appears on same exact bar**
What Did I do Well?
- My quality and choice of setup was alote better as i was able to focus after putting on 2 losers to start the day. I did not get frazzles nor force trades.
- Was able to stick with trade until weakness appeared, i missed a few Max outs but was content and able to focus on next opportunity and properly manage positions.
- REGAINED my Patients with selecting CHOICE setups after the first 2 loses.
- Used all my charts very well. the 2 minute $TICK moving ave kept me with the Trend.
What Did I do Poorly?
- Rushed into the market without signs of S/W, No Pro bars, Rambos, Support or Resistance all for NO REASON just anxious..
- My first 2 trades were HORRIBLE, i cut one for a 1.5 tick loss and took another max stop out for 2 points.
How Was My Mind Chatter?
- My quality of thought was ok as i was able to forget about my last trades and really focus on True opportunities.
- Kept reminding myself to focus on the current activity. This helped me to stay on the sidelines and pick choice setups to trade.
How will this affect my Progress?
This impatience can destroy your daily allotted opportunities and draw down your account.
2 consecutive losses can end the day, Lower confidence and cause negative spirals if allowed.
Solutions:
- What i could have done better is be Patient to start the day
- I could have entered on the break of the 4500 trend line, it was sneaky with not much volume on the actual move BUT it did setup very nice across the board, i passed consciously because i figured the profit margin was limited by the trend line. (The market dropped on this breakdown and never returned)
Intangible Jewels:
- $TICK moving average keeps you with the TREND, once it breaks above or below 0 line look for price pullbacks and Moving Average to pullback and fail at the 0 Line to confirm and entry.
- $TICK- look at Candle signals (ie. Doji's) that appear near Oversold/Overbought levels and also Cycle S/R.
- I notice in the micro trend that price tends to flow between Cycles toward the air(no S/R) or the Path of Least Resistance.
- Look for test in a rising market to appear on the 1500 tick and 2 minutes chart mainly (Not so much the 500 tick as it can be very noisy at times.
- After signs of accumulation you must wait to enter, be very patient and make price prove that its ready to be marked up, use a limit order if necessary to confirm markup then look for test in rising market.


